降维工具箱drtoolbox(目前仅支持MATLAB环境下运行)
drtoolbox是一个降维工具箱集成了众多流行的降维算法
1.drtoolbox支持以下34种降维算法
- Principal Component Analysis ('PCA')
- Linear Discriminant Analysis ('LDA')
- Multidimensional scaling ('MDS')
- Probabilistic PCA ('ProbPCA')
- Factor analysis ('FactorAnalysis')
- Sammon mapping ('Sammon')
- Isomap ('Isomap')
- Landmark Isomap ('LandmarkIsomap')
- Locally Linear Embedding ('LLE')
- Laplacian Eigenmaps ('Laplacian')
- Hessian LLE ('HessianLLE')
- Local Tangent Space Alignment ('LTSA')
- Diffusion maps ('DiffusionMaps')
- Kernel PCA ('KernelPCA')
- Generalized Discriminant Analysis ('KernelLDA')
- Stochastic Neighbor Embedding ('SNE')
- Symmetric Stochastic Neighbor Embedding ('SymSNE')
- t-Distributed Stochastic Neighbor Embedding ('tSNE')
- Neighborhood Preserving Embedding ('NPE')
- Locality Preserving Projection ('LPP')
- Stochastic Proximity Embedding ('SPE')
- Linear Local Tangent Space Alignment ('LLTSA')
- Conformal Eigenmaps ('CCA', implemented as an extension of LLE)
- Maximum Variance Unfolding ('MVU', implemented as an extension of LLE)
- Landmark Maximum Variance Unfolding ('LandmarkMVU')
- Fast Maximum Variance Unfolding ('FastMVU')
- Locally Linear Coordination ('LLC')
- Manifold charting ('ManifoldChart')
- Coordinated Factor Analysis ('CFA')
- Gaussian Process Latent Variable Model ('GPLVM')
- Deep autoencoders ('Autoencoder')
- Neighborhood Components Analysis ('NCA')
- Maximally Collapsing Metric Learning ('MCML')
- Large Margin Nearest Neighhbor metric learning ('LMNN')
2.安装
将压缩文件解压,并把整个文件夹拷贝到MATLAB安装的根目录“toolbox”内。
3.使用
下面举一个例子
3.1生成数据(或加载自己的数据)
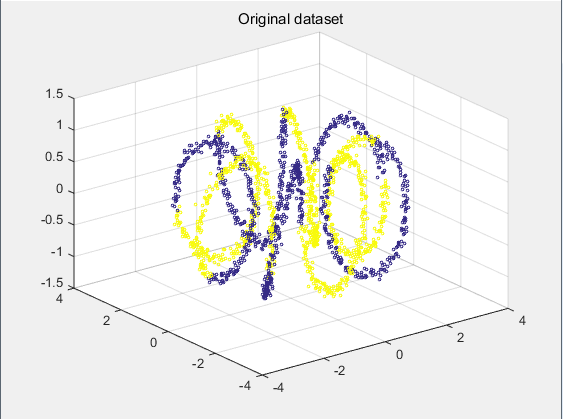
	[X, labels] = generate_data('helix', 2000);%生成数据X
	figure, scatter3(X(:,1), X(:,2), X(:,3), 5, labels); title('Original dataset'), drawnow

X是一个包含2000个样本点的3维特征向量数据,包含两个类别。
3.2用极大似然估计(Maximum Likelihood Estimate,MLE),来预估一下降到多少维度合理。
	no_dims = round(intrinsic_dim(X, 'MLE'));
	disp(['MLE estimate of intrinsic dimensionality: ' num2str(no_dims)]);
这一步在实际高纬度降维时,可以不做,直接跳到3.3,自己设定降维维度。这个例子里MLE建议降到2维。
3.3用降维算法进行降维
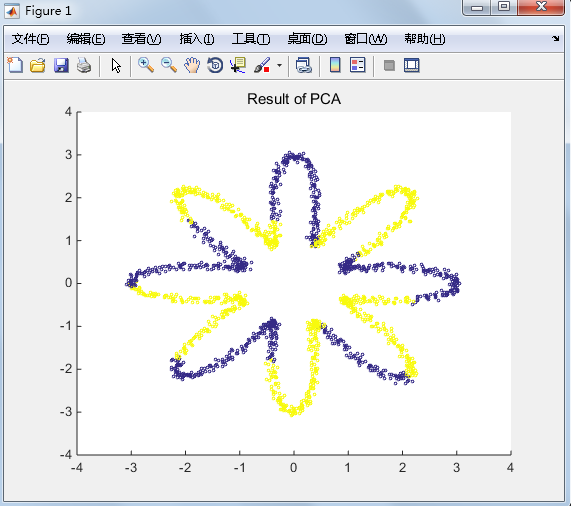
	[mappedX, mapping] = compute_mapping(X, 'PCA', no_dims);
	figure, scatter(mappedX(:,1), mappedX(:,2), 5, labels); title('Result of PCA');

这里使用了常规的PCA来降维。
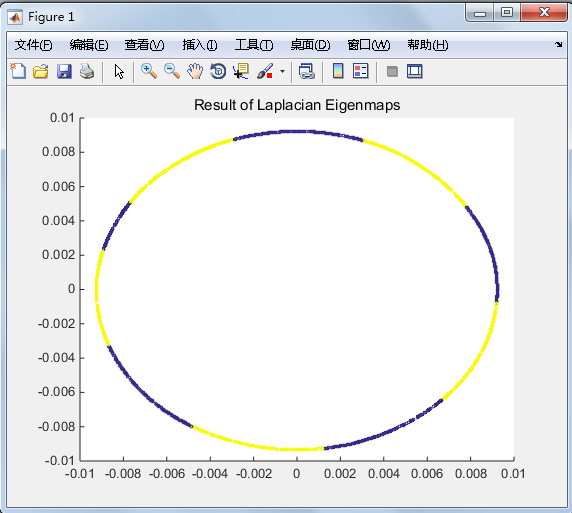
	[mappedX, mapping] = compute_mapping(X, 'Laplacian', no_dims);
	figure, scatter(mappedX(:,1), mappedX(:,2), 5, labels(mapping.conn_comp)); title('Result of Laplacian Eigenmaps'); drawnow

这里使用了常规的Laplacian映射来降维。
3.4函数说明
[mappedX, mapping] = compute_mapping(X, 'method name', Dimension)
X是一个特征矩阵,行数是样本数量,列数是特征维度;
'method name'是所使用的降维算法,使用时请使用上面例举的34种方法('XXXX')内的名字或者缩写带入;
Dimension是所要降到的维度,一般小于原始矩阵X的列数;
mappedX是降维后的特征矩阵;
mapping是降维的映射信息。
Last Update: 2021/9/10