|
|
|
|
|
|
N-gram
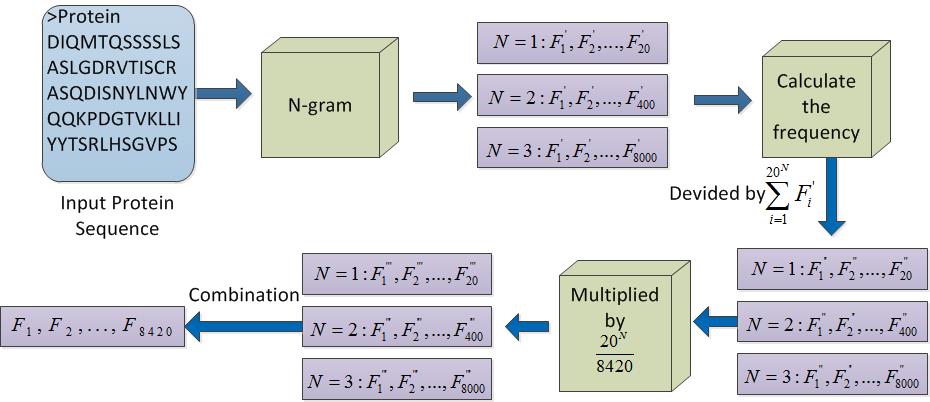
The n-gram frequency method can be used to obtain the 1-gram, 2-gram, and 3-gram features. Considering the three types of features with different contributions to the result, we attempted to multiply three types of features by different weights to generate an 8420-D feature vector.
N-gram-split
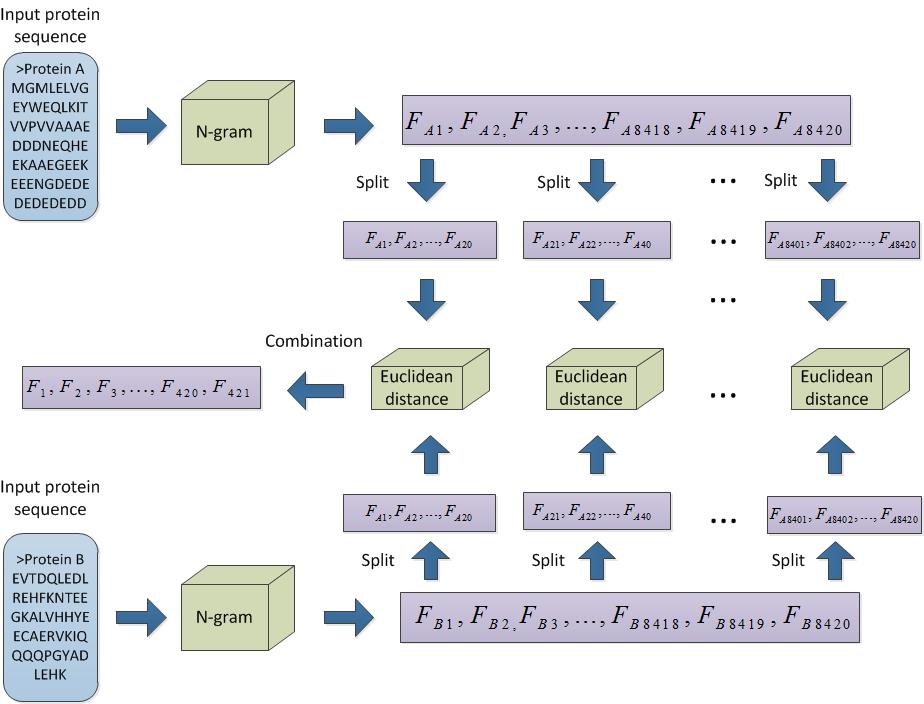
After a pair of proteins that has been encoded into two 8420-D vectors by n-gram was split into 421 20-D vectors. The Euclidean distance (ED) was calculated for each correspondent 20-D from two proteins. 20-D is called the split length. Finally, 421 values of ED were combined into a 421-D feature vector.
k-skip-2-gram
The k-skip-2-gram proposed in this study was developed from 2-gram. In particular, the k-skip-2-gram is the same as the 2-gram when the k equals 0. For example, for a protein sequence ACDEF, the results are as follows: 2-gram = {AC, CD, DE, EF}, 0-skip-2-gram = {AC, CD, DE, EF}, 1-skip-2-gram = {AD, CE, DF}, and 2-skip-2-gram = {AE, CF}. If we only consider the 2-skip-2-gram, then the final feature is a sparse vector and is difficult to deal with directly. Therefore, our strategy uses the result of k-skip-2-gram generated from i-skip-2-gram (i ¡Ü k) through union operation. In other words, 2-skip-2-gram = {AC, CD, DE, EF, AD, CE, DF, AE, CF} after the adjustment.
188-D
The 188-D feature encoding has two components, namely, the distribution of amino acids and the physicochemical properties. The first 20-D vectors are generated from the calculation of the appearance frequency of each amino acid. The other 168-D vectors consist of eight types of physicochemical properties.
Secondary structure

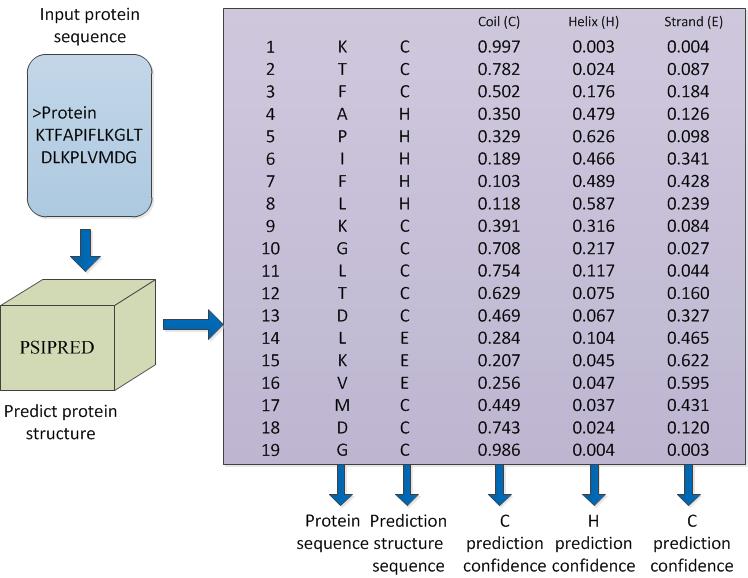
A confidence matrix was generated by calculating the prediction confidence of the input protein sequence. The prediction structure sequence has three states, namely, coil (C), helix (H), and strand (E). An element of the prediction structure sequence was determined by using the highest confidence level in the confidence matrix. In the sequel, a feature extraction method based on the prediction confidence matrix was used to generate the feature vector. The first three dimensions of the vector are C, H, and E. The remainder of the vectors consists of the distance of each feature measured by using the ED, cosine distance, Manhattan distance, and Chebyshev distance.
All Rights Reserved Copyright @ 2015|Jiancang Zeng
Last Modified in 2015/2/8

